Abstractions matter
But learn to see the assumptions within them.
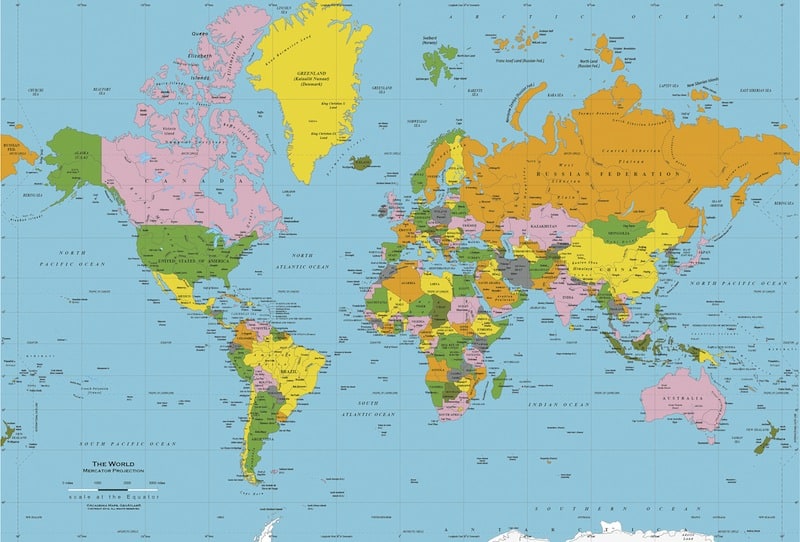
My earliest recollection of looking at the traditional world map has been that Greenland is such a big island. And that Denmark is lucky to own such a big island because it always used to say (Denmark) below it. I never truly connected the dots that Greenland’s land mass is not representative of its actual size. It only appears bigger because of the way in which a round three dimensional globe has been represented onto a flat two dimensional surface. And this choice of representation, which is keeping straight longitudinal lines for the purpose of navigation at sea, may be not be the appropriate one for a different purpose. Nothing captures this better than this clip from ‘The West Wing’ TV series. Watch it.
You need to remember the oft quoted adage - “The map in not the territory”. Even though we are used to the ‘Mercator’ projection as the way we look at the world, we need to realize it is only one of the many possible way to do so. Here is a link to an interactive comparison of different map projections. Lets understand that the map is nothing but an abstraction of the territory.
“Everything simple is false. Everything which is complex is unusable.” - Paul Valéry
Our understanding of any idea is through a process of abstraction - in which we create a simpler, tidy, model representation of the complicated, muddy, real-life experience. So abstractions are important because without them we would not be able to simplify and neatly model any real life idea or process. The abstraction helps us understand the idea better, but it builds in its own set of assumptions about the reality. It is important to understand these set of assumptions when we look at these abstractions.
This is even more important in data-stories because the creation of one is nothing but a set of abstractions. The first is a data abstraction, when you abstract the raw data to find the trend, outlier, deviation or pattern within it. Then you have the visual abstraction, where you choose the appropriate visual representation for abstracted data. Then you have the story abstraction where you choose the appropriate moments of representation, create the messaging for each one of them, frame them and transition between them to create a flow. And finally you have an interaction abstraction, where you allow the user to interact with the data-story in a limited way to enhance their engagement.
All these data-stories help us to understand the real world from the which the data is drawn. But never forget that they are just one possible abstraction of the real world, and have a host of assumptions build within them. Learn to see both the map and the territory.